Measure More Accurately
Assess actual versus default emissions, data quality, monitoring and verification readiness.

Find the emissions driving your product footprint, identify realistic reduction measures and understand which investments can improve operating performance and your CBAM position.
CBAM Advisory helps manufacturers, exporters and importers move from emissions measurement to practical action. We combine CBAM methodology, emissions accounting, technology assessment and commercial analysis so clients can decide what is worth changing before they invest.
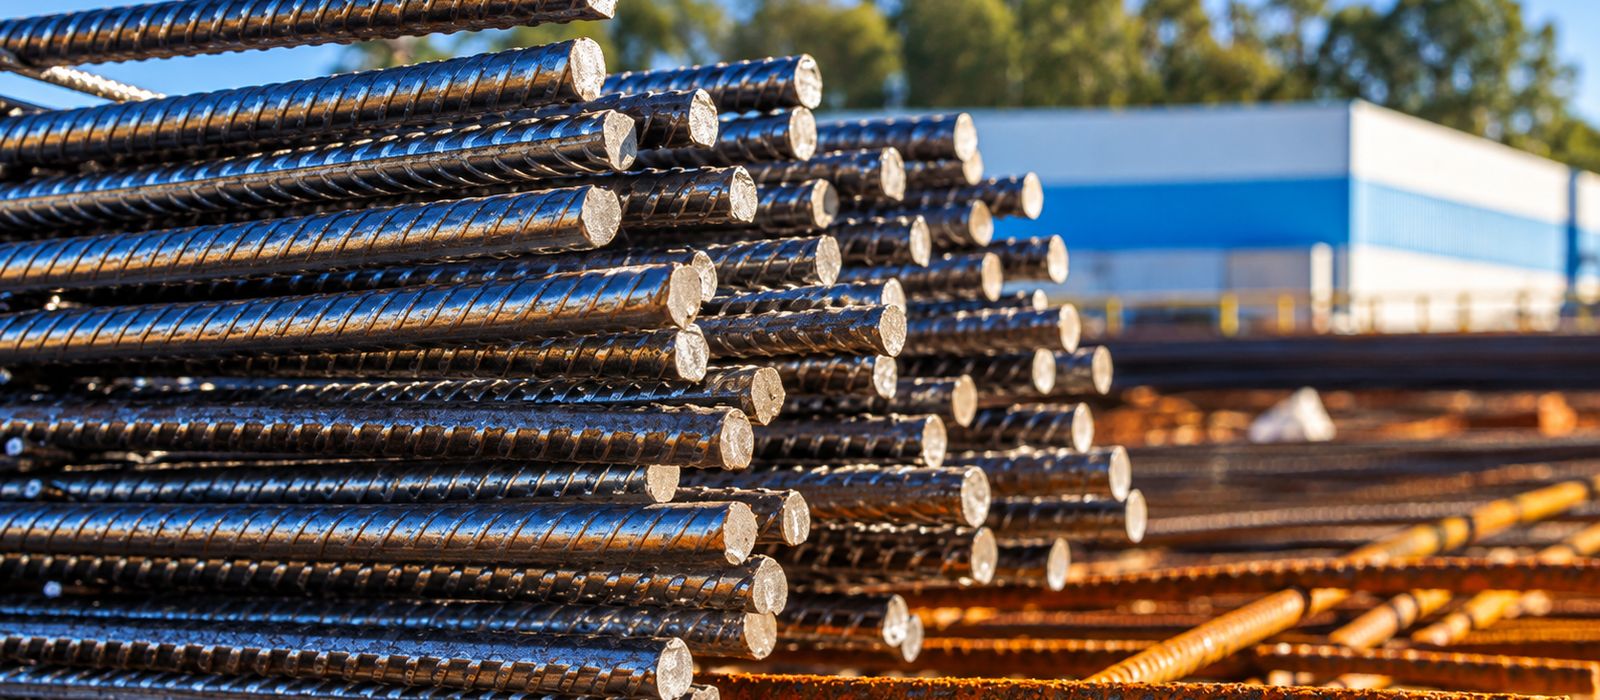
Assess actual versus default emissions, data quality, monitoring and verification readiness.
Identify process, energy, fuel, precursor and material opportunities that can reduce embedded emissions.
Quantify operating savings, CBAM impact, carbon-price adjustments where applicable and the investment case.
The comparison below distinguishes between the applicable default or current basis, verified actual emissions, and the emissions position after a credible reduction measure.
The current regulatory or reporting basis.
Installation-specific emissions supported by the required evidence and verification.
The emissions position after a technically credible reduction measure has been implemented and evidenced.
This example shows how the choice between applicable default values and verified installation-specific emissions data can materially change indicative CBAM exposure when actual emissions are lower. It is an illustrative case, not a general rule.
Basis of illustration: Egyptian urea, 2026; Q3 2026 CBAM certificate price: EUR 82.32/tCO2. The default and illustrative actual-emissions scenarios are used solely to demonstrate potential differences in indicative CBAM exposure.
| Scenario | Indicative CBAM cost | Difference vs default |
|---|---|---|
| Actual data - efficient plant | EUR 7.61/t | EUR 35.57/t lower |
| Actual data - average plant | EUR 16.67/t | EUR 26.51/t lower |
| Default values | EUR 43.18/t | Reference case |
What this illustrates: The opportunity is not simply to replace a default value with an actual value. We first determine the applicable methodology and assess whether verified actual emissions provide a different position. We then identify the main emissions drivers and evaluate whether practical technical improvements could reduce verified emissions further.
Illustrative only: actual CBAM liability depends on the applicable methodology, system boundaries, product and origin, precursors, free-allocation adjustment where applicable, eligible carbon-price deductions or relief, and the applicable EU certificate price or UK CBAM rate.
Using the same illustrative Egyptian urea case, the table below compares the total indicative annual CBAM cost under the default-value basis, verified actual emissions for an average plant, and verified actual emissions for an efficient plant.
| Annual import volume | Default values (EUR 43.18/t) | Actual data - average plant (EUR 16.67/t) | Actual data - efficient plant (EUR 7.61/t) |
|---|---|---|---|
| 10,000 t/year | EUR 431,800/year | EUR 166,700/year (EUR 265,100 lower) | EUR 76,100/year (EUR 355,700 lower) |
| 50,000 t/year | EUR 2,159,000/year | EUR 833,500/year (EUR 1,325,500 lower) | EUR 380,500/year (EUR 1,778,500 lower) |
| 100,000 t/year | EUR 4,318,000/year | EUR 1,667,000/year (EUR 2,651,000 lower) | EUR 761,000/year (EUR 3,557,000 lower) |
Illustrative arithmetic only. These figures apply the example rates of EUR 43.18/t, EUR 16.67/t and EUR 7.61/t to the stated annual import volumes. The figures in brackets show the arithmetic difference versus the default-value scenario. They are not guaranteed savings and do not replace a product-, installation- and reporting-period-specific CBAM calculation.
Enter the relevant annual import volume (tonnes) to see the indicative annual difference for this illustration. The result should be read together with the assumptions and disclaimer shown above.
Annual import volume: t/year
Illustrative arithmetic only. These figures apply the example rates of EUR 43.18/t, EUR 16.67/t and EUR 7.61/t to the stated annual import volumes. The figures in brackets show the arithmetic difference versus the default-value scenario. They are not guaranteed savings and do not replace a product-, installation- and reporting-period-specific CBAM calculation.
Rates used: EUR 43.18/t (default values), EUR 16.67/t (actual data - average plant) and EUR 7.61/t (actual data - efficient plant), with the Q3 2026 CBAM certificate price of EUR 82.32/tCO2.
See what this could mean for your product
We assess total emissions reduction separately from current CBAM-cost impact. A measure can be environmentally and commercially valuable even where its current CBAM effect is limited.
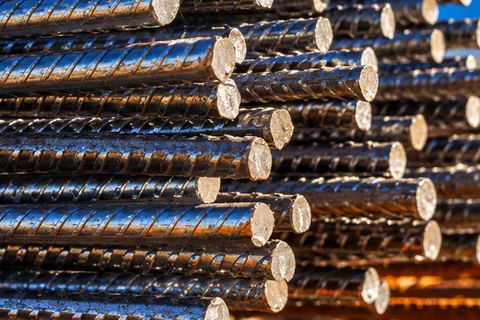
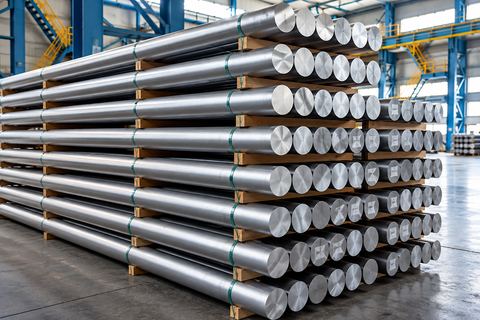
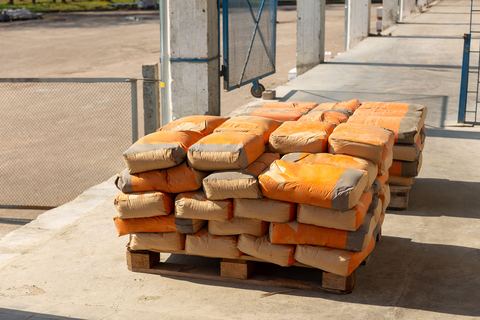
For each sector, we assess:
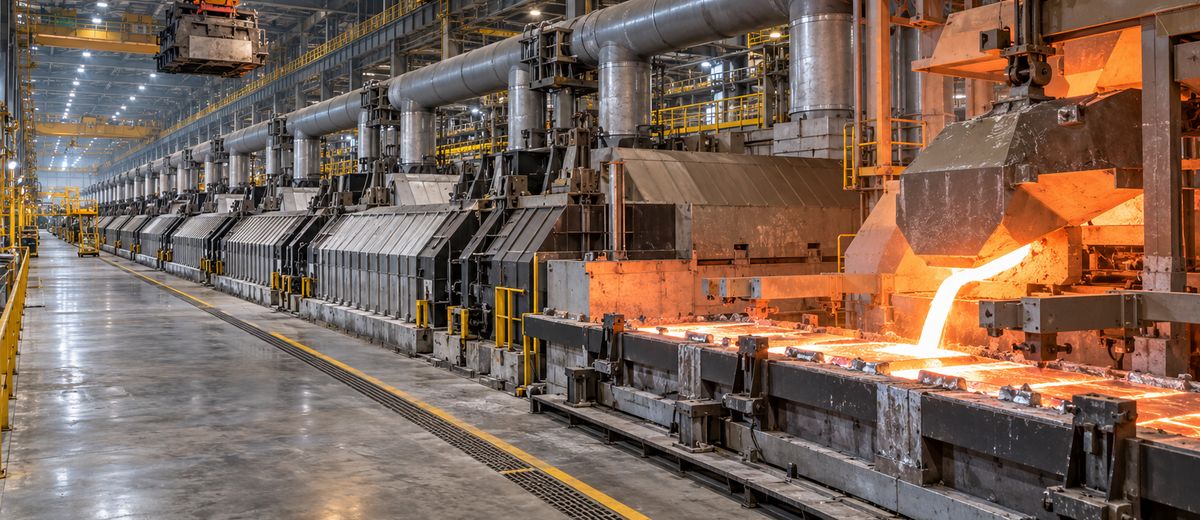
| Emissions Hotspot | Potential Solution | Emissions Impact | Current CBAM Relevance |
|---|---|---|---|
| Electrolysis / potroom | Pot optimisation, anode-effect control and PFC reduction | High potential where the issue is material | Direct emissions - potentially strong relevance |
| Melting / casting | Furnace optimisation, regenerative burners, electromagnetic stirring and heat recovery | Energy, fuel and yield improvement | Relevant where direct fuel emissions fall within the product boundary |
| Alumina refining | MVR, heat recovery, electrification and lower-carbon process heat | Can materially reduce refinery energy demand | Depends on precursor treatment and product route |
| Electricity | Renewable power, PPAs and electrical-efficiency measures | Potentially high total-footprint reduction | Current CBAM effect depends on the applicable indirect-emissions boundary |
| Materials / circularity | Higher recycled content, better scrap sorting and lower-carbon precursors | Can materially change product emissions | Depends on product route, precursor rules and methodology |
| Strategic technology | Inert-anode pathway | Potentially very high direct-emissions reduction | Strategic / emerging; project-specific assessment required |
We review the production route, energy use, fuels, raw materials, precursors and available emissions data.
You receive: A documented baseline and initial data-gap assessment.
We identify which emissions currently feed the relevant EU or UK CBAM calculation and which emissions remain important to the wider product footprint.
You receive: A clear CBAM-boundary assessment so the client knows which reductions currently affect CBAM cost.
We identify the processes, energy sources, materials and precursors that materially drive emissions.
You receive: A hotspot analysis showing where intervention is most likely to matter.
We screen realistic technical options against:
You receive: A shortlist of technically credible reduction opportunities.
For the shortlisted options, we compare the complete commercial case rather than CBAM savings alone.
You receive: A technical and financial comparison suitable for management decision-making.
Where a reduction opportunity requires specialist equipment, renewable energy or engineering, we identify suitable providers and support the client through technical and commercial evaluation.
Where appropriate, more than one provider can be compared. Recommendations are based on technical fit, emissions impact, economics, delivery capability and the client's circumstances.
Where we have a commercial relationship with a technology provider, we disclose it to the client.
You receive: A provider shortlist and structured basis for technical / commercial comparison.
The engineering or technology provider remains responsible for design, equipment, commissioning, warranties and technical performance commitments.
CBAM Advisory focuses on the emissions and CBAM workstream.
You receive: Updated emissions workpapers and an emissions-performance monitoring plan.
CBAM Decarbonisation & Investment Assessment
| Priority | Typical Character | Decision Question |
|---|---|---|
| Quick Wins | Operational or low-capex changes | What can improve performance quickly with limited investment? |
| Efficiency Investments | Targeted process or equipment upgrades | Which upgrades have a credible technical and financial case? |
| Strategic Decarbonisation | Major energy, technology or production-route changes | Which long-term investments materially change the emissions profile? |
| Opportunity | Investment | Emissions Impact | CBAM Impact | Timing |
|---|---|---|---|---|
| Process optimisation | Low | Medium | Potentially high where direct emissions are affected | Short |
| Targeted equipment upgrade | Medium | Medium to high | Project / regime dependent | Medium |
| Low-carbon electricity | Medium to high | Potentially high total-footprint impact | Depends on current CBAM boundary | Medium |
| Major process-route change | High | Potentially very high | Potentially high where CBAM-relevant emissions are reduced | Long |
We do not recommend equipment before understanding the production route, operating data, emissions hotspot, CBAM boundary and business case.
CBAM Advisory remains focused on the client's emissions and commercial objectives. Technology providers are selected according to technical suitability, project requirements and client circumstances.
Tell us what you produce, where the installation is located, which market you supply and what emissions information you currently have. We will identify the areas worth assessing and the information needed to build a practical reduction and investment plan.